This article discusses a September 2025 exchange-supply observation. The quoted price and the upcoming Federal Reserve meeting belong to that period. An exchange outflow can reflect custody transfers or internal wallet changes; it is not, by itself, evidence of a new purchase. The Bitcoin Scarcity Index spikes on Binance has reignited speculation among analysts and…
This article discusses a September 2025 exchange-supply observation. The quoted price and the upcoming Federal Reserve meeting belong to that period. An exchange outflow can reflect custody transfers or internal wallet changes; it is not, by itself, evidence of a new purchase.
The Bitcoin Scarcity Index spikes on Binance has reignited speculation among analysts and traders, marking its first significant jump since June. On-chain data suggests a sharp but short-lived squeeze in Bitcoin’s available supply, raising questions about whether this is a precursor to sustained accumulation by “whales” or simply a brief liquidity shock.
Understanding the Scarcity Index
A scarcity indicator must be read with its provider’s formula, exchange coverage and sampling period. The label alone is not a universal Bitcoin metric. Exchange reserves and available trading liquidity are also different quantities: an address movement can reflect internal custody or a new address classification. A spike may be consistent with reduced exchange supply, but cannot by itself prove whale accumulation, a purchase or reduced selling pressure. Check the actual series and methodology before comparing readings across providers.
When fewer coins are available for trading, even moderate buying activity can spark price surges. However, short-lived spikes can sometimes be the result of rapid speculative activity, often followed by corrections.
What makes this spike significant
This week’s jump is the first since June, when a similar surge coincided with Bitcoin’s price briefly touching $124,000. That surge lasted several days, suggesting large-scale accumulation was taking place behind the scenes.
The current spike, however, returned quickly to neutral and even dipped toward negative levels, suggesting the absence of follow-through buying or an overreaction by short-term traders.

Possible scenarios: accumulation vs. cooling
On-chain analyst Arab Chain of CryptoQuant suggests that this spike could either be:
- The beginning of whale-driven accumulation
Long-term investors may be withdrawing coins en masse, reducing liquidity on exchanges and preparing for a future rally. - A speculative blip
The fast retreat in the index indicates this may have been a momentary market squeeze rather than the start of a major trend.
This dynamic is key because historically, persistent scarcity signals precede sustained rallies. But in the absence of ongoing buying pressure, these jumps often cool quickly.
Liquidity crunch meets macro optimism
Adding complexity to the picture is broader market sentiment. Investor optimism is rising ahead of the Federal Reserve’s September 17 policy meeting, with analysts projecting medium-term price targets of $170,000 and potential long-term highs of $360,000 if the ongoing Bitcoin “supercycle” theory holds.
At the same time, data from CNF shows that liquid supply is falling. More Bitcoin is being moved to long-term holders’ wallets, with coins sitting untouched for months or even years. This shift creates a thinner market, meaning price movements can become more extreme as demand changes.
Why the Scarcity Index matters now
The index’s movement tells a story of pressure building beneath the surface:
- Long-term holders (“diamond hands”) are locking away more Bitcoin, leaving less to trade.
- Exchange reserves are at multi-year lows, intensifying the effect of any new buying.
- Speculative sentiment remains high, which can amplify volatility when liquidity is thin.
However, Arab Chain cautions that without sustained activity over the next few days, this spike may prove to be “a warm-up” rather than a breakout moment.
Interpreting the roller-coaster index pattern
Over recent months, the Scarcity Index has swung above +6, only to collapse back toward zero. This volatility reflects how short-term traders and institutional players react to liquidity shocks.
- If prices hold steady while the index drops back, it may indicate that buying momentum is fading.
- A renewed surge in the index could confirm genuine accumulation, leading to upward price pressure.
This tug-of-war shows how fragile sentiment is at current price levels. Traders should expect abrupt swings as liquidity tightens further.
September 2025 Market Snapshot
As of press time:
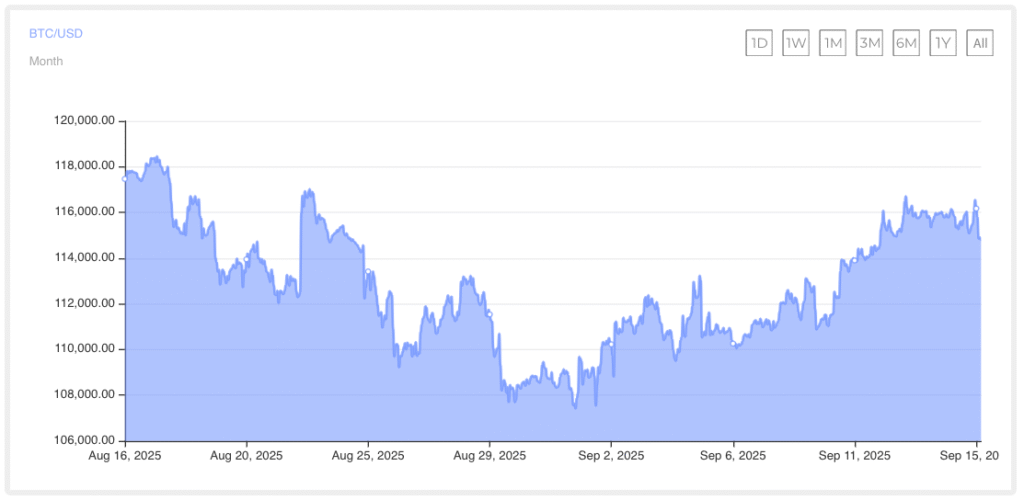
- BTC price: $114,855.57
- 24-hour change: -1.03%
- Daily trading volume: $44.49 billion
Bitcoin remains in a consolidation phase, hovering around record highs, yet on-chain data suggests that beneath the surface, liquidity constraints could make upcoming moves sharp and sudden.
The road ahead
For now, this spike is an important data point but not a definitive signal. Here’s what to watch:
- Exchange outflows: Sustained withdrawals from Binance and other exchanges would confirm accumulation.
- Volume trends: Rising spot buying volume will separate a genuine rally from a false alarm.
- Federal Reserve decisions: September 17’s policy meeting could set the tone for global liquidity, impacting Bitcoin’s near-term trajectory.
- Holder behaviour: Continued growth in long-term holdings will amplify scarcity effects, making rallies more explosive.
Whether this is the start of a major accumulation cycle or a temporary spike, the Scarcity Index shows that Bitcoin’s market structure is tightening—and that alone raises the stakes for every move ahead.
FREQUENTLY ASKED QUESTIONS
It depends on the provider’s formula and coverage. A reading associated with exchange balances is not, by itself, proof that investors purchased Bitcoin. Internal transfers, custody changes and address classification can affect a series. Check the exchange, sampling period and methodology before interpreting a spike.
Short-term traders and liquidity squeezes can create temporary spikes that fade quickly without sustained buying.
If exchange outflows continue and long-term holders keep removing supply, scarcity could push prices higher.
The $114,855.57 price, 1.03% daily decline and $44.49 billion volume in this article are the September 2025 reporting snapshot, not a current quotation. Price and volume vary by source and timestamp. Use a current market feed and executable provider quote for a transaction.