
The October 2025 deadline has passed, and Bitcoin did not finish that month above $140,000 on the exchange data checked here. I would read this forecast as a case study in how a persuasive probability headline can outrun its evidence—not as a current price target. Our check of Coinbase Exchange’s BTC-USD daily candles puts the 31 October 2025 UTC close at $109,555.27.
The original story concerned Timothy Peterson’s October 2025 model. Cointelegraph’s 8 October report attributed a 50% month-end probability above $140,000 and 43% below $136,000 to him. It described hundreds of simulations using daily prices from 2015. Those are reported model outputs, not probabilities independently established by this magazine.
Risk warning: virtual assets can lose some or all of their value and experience extreme volatility. This is historical reporting and an assessment of a forecast, not a recommendation to buy, sell or use leverage. Dubai’s VARA risk-disclosure rules explicitly identify volatility, illiquidity and potential loss; a model headline does not remove those risks.
The retained hero is illustrative artwork. Its $140,000 overlay is the historical target discussed here, not a current quotation, result or recommendation.
What the forecast actually claimed
The relevant Peterson post is linked for provenance, but direct retrieval was blocked during this review. I have therefore attributed the forecast to the contemporaneous report rather than implying that we inspected his full model, interviewed him or reproduced the simulations.
The important distinction is the event being forecast: finishing the month above a level is different from touching that price during the month. A headline about the chance of “hitting” a target can blur that difference. I would write the deadline, price source and settlement convention beside any probability before comparing it with an outcome.
The earlier article escalated “hundreds” into “thousands” and described the simulation as though its inner workings had been examined. That was not supported by this review. A list of historical prices alone does not tell us the sampling procedure, treatment of extreme moves, number of independent scenarios or whether the model was tested on data it had not already seen.
My standard for calling a forecast useful is stricter than “it used data”. I want the rule specified before the result, a reproducible input period, an exact outcome definition and an honest record of successes and failures. Without those, I would treat a precise percentage as a claim to investigate—not a reliable trading edge.
The historical price context—and the outcome
The contemporaneous report quoted BTC around $122,032. From that reference, the move to $140,000 is approximately 14.72%: (140,000 ÷ 122,032 − 1) × 100. That is a calculation from a historical quotation, not today’s price or a reproduced model result.
I checked the outcome separately using Coinbase Exchange’s public BTC-USD daily-candle endpoint. The request covers 1 October to 1 November 2025 at 86,400-second granularity. After excluding the 1 November boundary candle, there are 31 October UTC candles. Their highest recorded high is $126,296; the final 31 October close is $109,555.27. Neither reaches the $140,000 threshold on this venue.
Keep the measurement consistent. The same series gives a 1 October open of $114,067.71, making the open-to-final-close change approximately −3.96%. That is an explicitly defined Coinbase calculation, not a universal October return or a silent replacement for a different provider’s month-end benchmark. Prices and cut-off conventions differ between sources.
Why a seasonal average is not a probability
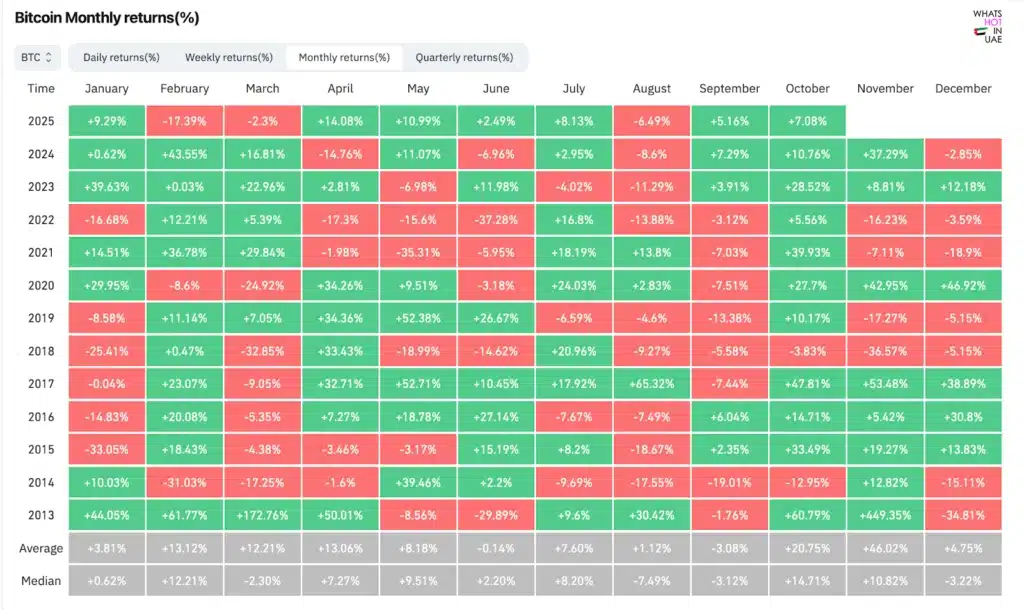
The retained monthly-return image is an old snapshot: its October 2025 cell is still a partial-month +7.08%. I would not present that green cell as the completed month’s performance. Its average and median are also different—20.75% versus 14.71%—which is a useful reminder that “average” does not mean the typical outcome must recur.
One source of confusion is the difference between a return and a probability. A 20% average historical return does not mean a 20% chance of a gain, and it does not establish a 50% chance of reaching a chosen target. To connect those statements requires an explicit distribution and assumptions about how well the sample represents the period being forecast.
I would also separate a proposed explanation from a demonstrated cause. References to institutional rebalancing or year-end positioning do not establish how much buying occurred, which days it affected or whether it drove the month’s price. This review does not independently verify those mechanisms for the October 2025 forecast.
What the miss does—and does not—tell us
The target was missed on the data checked. That matters, and an archive should say it plainly instead of leaving an old bullish introduction in place. But one failed 50% forecast does not, by itself, prove a model is statistically invalid: an event with a genuine 50% chance can fail to happen.
A meaningful assessment would examine a sequence of forecasts issued before their deadlines, with an unchanged scoring rule and full inclusion of misses. It would also distinguish market shocks and liquidity risk from excuses introduced only after a prediction fails.
I would ask for calibration: among many forecasts labelled 50%, how often did the defined event actually happen? Then I would compare the record with a simple baseline over the same periods. This article has not run that study, so it does not award the model a success rate or declare it worthless from one outcome.
A quoted percentage is not enough information to size a position. It says nothing, on its own, about the size of losses in the other outcomes, fees, financing costs or whether a leveraged position survives the path to a deadline. The outcome and the path are separate questions.
More bullish voices are not independent validation
The original story also gathered bullish commentary. I would not turn a collection of optimistic posts into independent confirmation of a simulation: people responding to the same price action can share a view without providing separate evidence that its probability is calibrated.
Before using another analyst’s opinion, I would ask whether it predicts the same outcome and deadline, whether it gives a testable rule, and whether its reasoning is independent of the first forecast. A general expectation of higher prices does not validate a specific month-end $140,000 probability.
Excitement belongs in market commentary, but it is not a measurement. I am more interested in the forecast’s full record than a confident line celebrating a rally.
This update does not retain the earlier analyst soundbites as direct interviews or fresh opinions. There was no interview by this magazine, and the assessment here does not require a second layer of optimistic quotations.
The same discipline applies to scarcity and accumulation indicators: identify the actual series, its timestamp and what it measures. Do not silently infer market-wide sentiment, future interest rates or a guaranteed altcoin rally from a single indicator.

The forecast card I would save before the deadline
I would keep a simple forecast card, not just a screenshot of the target: publication timestamp; exact event and deadline; quoted probability; venue or benchmark; versioned assumptions; and the rule for recording the result. That makes it harder to switch from “close above” to “touched” after the event or keep only winning predictions.
A simulation makes assumptions explicit, but does not eliminate bias. The selected sample, starting price, distribution, treatment of extreme moves and model calibration all affect the result. A reported 50% estimate is conditional on those choices; it is not proof of a real-world 50% chance for a new period. Assess a forecasting model using outcomes it did not use to fit its parameters, not only how well it describes a historical chart. The 2025 forecast should remain distinguishable from any current market prediction.
A transparent, hypothetical example: suppose a model gives a 50% chance of a 15% gain and a 50% chance of a 25% loss. Its two-outcome average return is (0.5 × 15%) + (0.5 × −25%) = −5% before costs. Those are invented teaching inputs, not Peterson’s distribution. They show why a 50% upside probability alone is not an attractive-return calculation.
Reading the retained October table accurately
- 2013: +60.79% in the retained snapshot.
- 2017: +47.81% in the retained snapshot.
- 2020: +27.7% in the retained snapshot.
- 2021: +39.93% in the retained snapshot.
- 2022: +5.56% in the retained snapshot.
- 2023: +28.52% in the retained snapshot, correcting the earlier text’s +23%.
These entries transcribe selected October cells in the existing image; they are not a new audit of CoinGlass’s complete dataset. The chart also contains negative Octobers, including 2014 and 2018. I would read the full spread, not pick only the green years and label the result inevitable.

A price target is not a complete decision
The original article treated a hypothetical rally as a reason to expect wider institutional enthusiasm and stronger altcoins. I would not use that as an action plan. A higher Bitcoin price does not establish another asset’s return or prove that Bitcoin reliably protects a particular household’s purchasing power.
For a UAE reader assessing any forecast-led promotion, I would separate four checks:
- The claim: what exactly must happen, by which deadline, for the prediction to count as correct?
- The downside: what losses and liquidity constraints are excluded from an upside-only headline?
- The transaction: which fees, spreads, financing or withdrawal costs apply to the actual product?
- The provider: is the actual legal entity and activity authorised for the intended customer? A price forecast is not a licence or a safety assessment.
I would verify a provider separately through the relevant regulator and read the product terms. This article does not recommend a platform, establish anyone’s eligibility or treat regulation as protection against market losses.
My verdict: judge the record, not the confidence
I would not put money behind this headline alone. The useful part now is the lesson: preserve the original deadline, check the defined outcome, and demand a record that includes the misses. An expired prediction deserves an outcome assessment, not another coat of bullish language.
Our Coinbase check shows the reported $140,000 month-end target was not reached on that venue in October 2025. It does not establish the probability that should have been assigned in advance, or the accuracy of every forecast by the analyst. Those are larger questions requiring the model and a proper evaluation record.
Research refreshed: 20 October 2026 UAE time. The contemporaneous report was read, direct access to the linked X post was blocked, and 31 October UTC daily candles were checked through Coinbase Exchange’s public API. Three body images and the hero were visually inspected; the old monthly-return screenshot is preserved as a dated snapshot, not a live dataset. No model replication, trading test or personal financial advice is claimed. Original author, publication date, media, canonical and the selected noindex/follow setting are preserved.
Questions about the historical forecast
What was the Bitcoin $140K prediction?
It was an October 2025 forecast attributed to Timothy Peterson: a reported 50% chance of finishing that month above $140,000. It is not a current October 2026 probability or a forecast independently reproduced by this magazine.
Did Bitcoin finish October 2025 above $140,000?
Not on the Coinbase Exchange BTC-USD series checked here. Its 31 October UTC daily candle closed at $109,555.27, and the highest high among the 31 October candles was $126,296. This is a venue-specific historical check.
Does one missed 50% forecast prove the model is wrong?
No. An event with a genuine 50% probability can fail to happen. Evaluating calibration requires many forecasts recorded before their deadlines, consistent outcome definitions and inclusion of failures, not one selected result.
Does an average October gain establish the chance of reaching a target?
No. An average return and a probability are different quantities. A target probability needs a defined distribution, deadline and assumptions; a seasonal average alone does not establish it.