A “god candle” is market slang for an unusually large price candle over a chosen trading interval. It is not a standard indicator proving that a rally is imminent. Crypto commentary often links such moves to liquidity, leverage and changes in money supply, but those links need evidence rather than an unnamed insider prediction. This…
A “god candle” is market slang for an unusually large price candle over a chosen trading interval. It is not a standard indicator proving that a rally is imminent. Crypto commentary often links such moves to liquidity, leverage and changes in money supply, but those links need evidence rather than an unnamed insider prediction. This guide explains the terms, the data to check and why a dramatic candle does not establish a sustainable trend.
The useful questions are which market and time interval the candle describes, whether trading depth supported the move, and what data is being used to forecast another one. A chart can show a past price jump without establishing that another jump is about to occur.
1. Market Makers Are Positioning for a Crypto Rally
A market maker quotes buying and selling prices and may hedge its exposure. Its activity is not automatically a directional prediction that prices will rise. To claim accumulation or a shift in positions, identify the entity or dataset, time window and instruments. This article does not present unnamed “smart money” or insider activity as verified current evidence.
Liquidity and execution: Depth is the amount available to trade near the quoted price. It varies by asset, venue and time. A large buy in a shallow market can create a dramatic candle without sustained demand. Inspect order-book or execution data before calling a move evidence that institutional liquidity has returned.
Positioning needs a source: A wallet transfer, open derivative position and executed spot purchase are different observations. A transfer does not by itself identify a market maker, prove accumulation or reveal a bullish motive. Name the dataset, timestamp and instrument before interpreting a change as “smart money” preparing for a rally.
Volatility is not a direction signal: Larger price swings can increase opportunity and loss exposure. Market makers may hedge or reduce activity under stress, so volatility is not proof that they profit from every move or expect an imminent rise. Assess spreads, liquidity and positioning rather than assume the same response from every participant.
What this means: A liquidity or positioning observation may help explain market conditions, but it does not prove that crypto is primed for an explosive rally. Interpretation needs a dated source and competing explanations, particularly when hedging and market-making activity are mixed with long-term investment holdings.

2. The Global M2 Money Supply is Sending a Bullish Signal For The Surge
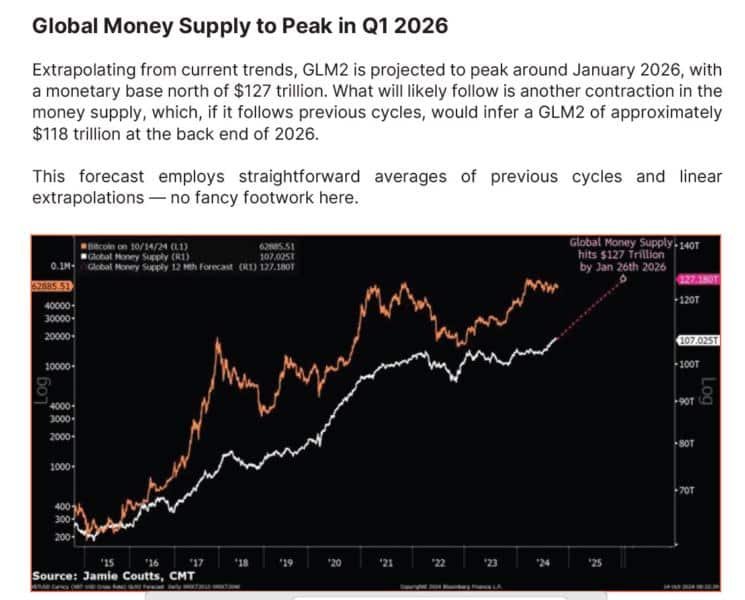
M2 is a monetary aggregate, not a direct measure of money flowing into Bitcoin. The Federal Reserve’s M2 series on FRED is a US measure with stated definitions, units, frequency and revisions. A chart labelled “global M2” generally combines country data according to a provider’s choices. Check coverage, currencies and exchange-rate treatment before comparing it with a crypto price. A correlation in a chosen period is not proof that every money-supply increase causes a rally.
🔥 Why M2 Growth Matters for Crypto:
💰 More Money in the System = More Speculation – When governments print money, it doesn’t just stay in savings accounts. Excess liquidity finds its way into risk assets, including crypto.
Test the historical relationship: To claim that a money aggregate predicts Bitcoin, state the dates, currency, sample and lag used. Compare periods that contradict the claim as well as those that fit. Similar chart shapes do not establish that every rally follows money-supply expansion or that one variable caused the other.
Do not reduce a market cycle to one cause: Interest rates, credit conditions, leverage, demand and counterparty events can interact. A money-supply series alone cannot establish why an entire crypto market fell or predict its next cycle. A causal claim needs more than a chosen correlation and should acknowledge other explanations.
The key point: Money-supply data can inform a macroeconomic discussion, but it does not establish when a crypto rally will begin or how large it will be. Look at publication lags and revisions as well as the chart’s direction, and test periods when the proposed relationship did not hold.
3. What to Expect: Crypto’s Next Big Surge
Scenarios involving larger liquidity, stronger demand or more leverage should be labelled as scenarios. They are not verified outcomes or recommendations to prepare for an inevitable “altcoin supercycle”. Greater leverage can make gains and losses more abrupt, while a rapid price move can reverse when liquidity is thin.
🚀 “God Candles” & Rapid Price Surges – Bitcoin and Ethereum could see massive daily gains as liquidity floods into the market, leading to what many anticipate as crypto’s next big surge.
💎 Altcoin Supercycle – Smaller, high-potential altcoins often outperform BTC & ETH during liquidity-driven rallies. Outperformance is a possible scenario, not an established outcome.
📊 Increased Leverage & Volatility – With more liquidity, traders will increase leverage, making the market more volatile but also potentially more rewarding.

Final Thoughts: Is Crypto About to Explode?
A credible forecast names its inputs, dates and assumptions. Without those, a claim that market makers and on-chain activity prove the next bull cycle is unsupported. Compare actual trading depth, positions and macro data rather than infer a shared market-maker view from a price narrative.
Keep an eye on CoinMarketCap for daily info.
The useful question is which evidence supports the scenario and what would invalidate it. A dramatic story about the next surge should not replace a defined dataset or a realistic assessment of execution and loss risk.
A large candle can reflect news, liquidation, low liquidity or a concentrated order. To decide whether it is part of a broader trend, compare subsequent prices, volume and depth over a stated period. There is no guaranteed “next surge” established here.
Check out: UAE CRYPTO: THE FUTURE OF FINANCE
A Checklist for a “God Candle” Claim
- Interval: Is this a minute, hour or daily candle? The label changes with the chart.
- Market: Is it a liquid spot market, a derivatives contract or a thin token pair?
- Evidence: Name the timestamp, volume, depth and any liquidation data rather than cite anonymous insiders.
- Macro series: Identify the country coverage, currency conversion and lag of any money-supply chart.
- Forecast: Explain the assumptions and what would invalidate the scenario. A past candle does not require another one.
A low-priced token can show a huge percentage jump in a shallow market while leaving few buyers at the displayed price. That makes liquidity and execution cost part of the explanation, not an afterthought. For related measures, read our sentiment guide and Bitcoin dominance explainer.